
 Could infographics bridge the gap between the digital haves and have nots? An infographic is a digital poster. It usually combines images with text and symbols to deliver a message. The skills required to create an effective infographic might hold a key to narrowing the “digital divide” (Howell, 2012, p. 55).
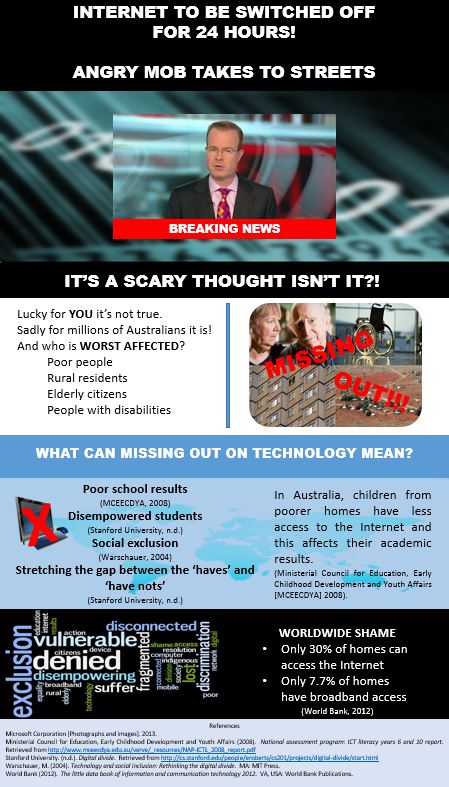
Students without digital technology skills can suffer academically (Ministerial Council for Education, Early Childhood Development and Youth Affairs, 2008). There can also be social consequences (Warschauer, 2004) as the above infographic highlights. Regularly using technology in the classroom can contribute to students’ digital enablement (Diamond, 2010). Incorporating technology such as infographics into lessons can motivate students (Chen, 2010) and provide the genuine technological learning opportunities stipulated in the national curriculum (Australian Curriculum, Assessment and Reporting Authority, 2013).
Developing infographics demands the critical thinking and analytical skills so highly valued in society (McDevitt, Ormond, Cupit, Chandler and Aloa, 2013). Further, students creating infographics need sufficient internet research capabilities and computer graphic design skills (Piktochart, 2014). Infographics can provide the stimulation necessary to engage students (Perry, 2012) and equip them with essential digital skills (Tucker, 2013). Accordingly they might be a valuable component in the bridge to span the digital chasm.

References
Australian Curriculum, Assessment and Reporting Authority (2013). Technologies. Retrieved from http://www.australiancurriculum.edu.au/technologies/rationale-aims/technologies
Chen, M (2010). If technology motivates students, let’s use it! Retrieved from http://www.edutopia.org/blog/motivating-students-technology
Diamond, L. (2010). Liberation technology. Journal of democracy. 21 (3). p. 69-83. DOI: 10.1353/jod.0.0190
Howell, J. (2012). Teaching with ICT: Digital pedagogies for collaboration and creativity. South Melbourne: Oxford University Press.
McDevitt, T.M., Ormond, J.E., Cupit, G., Chandler, M., & Aloa, V. (2013). Child development and education. Frenchs Forest, N.S.W.: Pearson.
Perry, D.L. (2012). What makes learning fun?: Principles for the design of intrinsically motivating museum exhibits. Lanham, USA: AltaMira.
Piktochart (2014). Ways of use. Retrieved from http://piktochart.com/education/
Tucker, C. (2013). Student designed infographics: Process and products. Retrieved from http://catlintucker.com/2013/11/student-designed-infographics-process-products/
Warschauer, M. (2004). Technology and social inclusion: Rethinking the digital divide. MA: MIT Press.
